

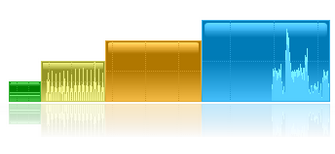
Performance Monitor is a set of graphical desktop widgets for basic monitoring of your CPU, RAM, disk and network usage.
Launching the package displays four tiny graphs, one for each resource. Hovering your mouse over a graph tells you what it's monitoring, and gives you a summary figure or two: percentage free RAM, read/ write disk usage, kernel and user CPU usage, upload and download speed rates.
Right-clicking a graph and selecting Settings gives you some useful options. You can change the graph size, transparency, set it to be always on top, set a "Pass-Through Mode" which enables clicking objects under the graph, or turn an individual graph off altogether.
Graphs can be positioned individually, or snapped together and dragged around as a block (hold down Ctrl, press the left mouse button and drag). Right-click a graph and you're able to save these positions or restore them later.
If you'd rather keep your desktop clear for real applications, no problem, you're able to hide one or all of the graphs and access their data from system tray icons instead.
Verdict:
There's no detailed analysis of your PC here, no lists of CPU-hogging processes or apps with open network connections-- it's just a few very small graphs. But if that's what you need, the ability to make them transparent and click on objects underneath them could be very handy.
Your Comments & Opinion
A feature-packed desktop gadget
Monitor the state of your Mac from the menu bar
Monitor your CPU/ RAM usage, free up RAM and set process priorities with a single tool
Monitor your CPU/ RAM usage, free up RAM and set process priorities with a single tool
Check the health of your disks and memory and detect common problems with your Mac
Measure the performance of your CPU and RAM with this straightforward benchmark
Measure the performance of your CPU and RAM with this straightforward benchmark
Get the vital stats of your Android device with this benchmarking tool
A complete clean-up, maintenance and optimisation toolkit for your computer
Make the most of your multi-monitor setup using this handy utility